1. HOW TO ATTAIN THE LIVING WAGE IN CHINA
For China, on behalf of the Wages in Context reporting, due to the short time span available the WageIndicator team was not able to gather information for a Living Wage calculation neither through online nor through offline surveying. We therefore present below considerations that may be relevant for calculating a Living Wage for China, supported by expert observations.
In the late 1970s China initiated market-oriented economic reforms and opened up for private investment. In the framework of an export-oriented policy, the government stimulated the textile and garment industry, seeking to capitalize on the huge supply of low-cost labour. By the time China joined the World Trade Organization (WTO) in 2001, it had become the world’s largest garment and textile producing country. From the early 1980s on, foreign investors were allowed to engage in joint-ventures with Chinese firms as well as, in most sectors including garment production, to operate independently. Among China’s clothing producers the share of foreign-owned firms (FIEs) and joint ventures grew to 39 per cent in 2011. At 51 per cent, their share in clothing manufacturing employment was even larger.
Within China, the growth of garment production was driven by the masses of workers migrating to the Eastern coastal regions. Single women between 18 and 25 years of age were the first choice of managers. Yet since 2003 labour shortages in the coastal regions have led to an influx of both married women and men. In the 2000s, garment producers in the coastal regions found themselves squeezed between low contract prices, rising input costs, stricter labour and environmental regulation, labour shortages, and the struggles of migrant workers for better wages and working conditions. In large cities this pressure was most strongly felt, and for example in Shanghai the garment industry dwarfed. Chinese garment manufacturers have been encouraged to upgrade production (‘Go Up’); through subsidies and infrastructural development to relocate to less-developed areas in the Western and Central provinces (‘Go West’), or to outsource outside China (‘Go Out’). However, within China still 70 per cent of garment output stems from the coastal provinces Guangdong, Fujian, Jiangsu, Shandong, and Zhejiang.
While China’s potentially huge domestic garment market has rapidly gained importance, its share in world garment exports increased from 14.4 per cent in 1995 to 37.3 per cent in 2014. At the same time, the share of these exports in the total merchandise exports of China decreased from 16 to 8 per cent. This reflects the country’s structural shift to exports based on higher-level technology. We estimate that in 2015 4.9 million were employed in China’s garment industry of which 3,234,000 women. We found that in a sample of 25 global garment buyers, in 2013-14 all except one had Chinese suppliers; China’s share in their total supply varied between 16 and 65 per cent with 33 per cent as the median.
2. MINIMUM WAGES
Concerning minimum wage setting, the Ministry of Labour and Social Security in 2004 promulgated the Rules for Minimum Wages (‘2004 Regulation’). The Ministry, China’s Enterprise Directors Association (CEDA) and the only legal trade union, All China Federation of Trade Unions (ACFTU), are involved in minimum wage setting. Minimum wage levels are differentiated geographically, by provinces and regions; there are no sector-specific provisions. Within provinces differentiation in local conditions is taken into account; minimum levels vary widely across and within provinces. The Kaitz indices (minimum wages calculated as a percentage of average wages) varied considerably across provinces, averaging 34 per cent in 2012 but varying between 23 and 50 per cent. The Kaitz rates for the ‘garment provinces’ in 2012 were: Fujian 37, Guangdong 35, Jiangsu 34, Shandong 40, and Zhejiang 36.
3. COMPLIANCE
In China, compliance with wage regulations has been well-researched. For 2009 and for six provinces including Guangdong, researchers found high compliance with statutory minimum wages: fewer than 3.5 per cent of full-time workers earned less than the minimum wage. Remarkably, at 2.2 per cent non-compliance in textile and garment manufacturing was even lower. On the other hand, at 15.4 per cent overall non-compliance was high in the Guangdong province. Also, 24 per cent of textile and garment workers did not receive the legally-mandated overtime pay.
The outcomes are in line with the opinions of the experts surveyed, namely, that garment workers earning below or at the MW in China tend to work in lower tiers of the supply chain and/or as homeworkers, and are more likely to be female and low-skilled.
There are indications that in the garment industry improvement of working conditions, and compliance with regulation in this respect, is lagging behind. A number of observers note an on-going erosion of labour regulation. Since the early 2000s a considerable number of wildcat strikes has taken place each year, also in textile, garment and shoe-making factories. These ‘mass disputes’ were mostly successful and resulted in strong wage increases. However, these increases often seem to have been traded off against strikers’ demands for better working conditions and removing discrimination against females and migrant workers. We should add that a substantial proportion of Chinese garment workers, likely over one-third, have been and are informally employed, that is, they do not have an employment contract or are not covered by social security.
4. WAGES IN CONTEXT IN CHINA
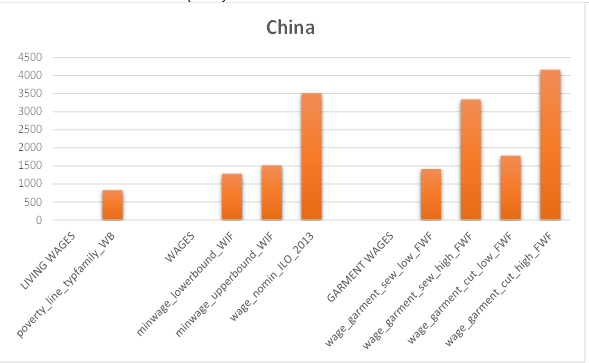
In Figure 4 we present the monthly amounts of the poverty line, the minimum wages, the overall 2013 average wages according to the ILO, and the average wages of four categories of Chinese garment workers based on Fair Wear Foundation (FWF) information. As minimum wage levels we have chosen the relatively low minimum wage in Yangzhou, Jiangsu province (RMB 1,280), and the relatively high MW in Dongguan and Zhongshan, both Guangdong province (RMB 1,510). Out of necessity, garment wages are presented for one province only with a concentration of garment factories (Zhejiang). The figure shows that the wages of all workers and the wages of skilled garment workers were substantially above the upper bound minimum wage. Yet, the wages of the low-skilled garment workers were in between the two minimum wage levels.
Figure 1: Minimum wages, total wages and garment wages in China, monthly amounts in Chinese Renminbi (RMB)
Source: Wages in Context in the Garment Industry in Asia. Amsterdam: WageIndicator Foundation, April 2016.
5. CHINA COMPARED
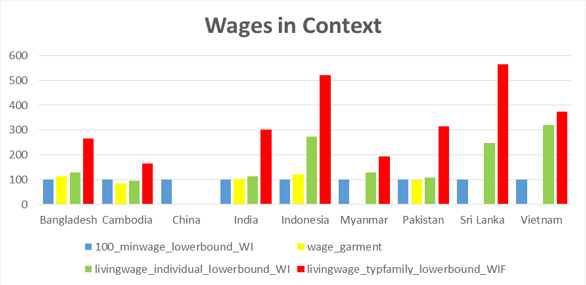
Figure 2 shows wages in context: the distances between the various wage levels calculated for the nine countries, setting the lower bound statutory minimum wage as 100 and relating this to the garment wages derived from official surveys as well as the estimated lower bound living wages for individuals and for typical families. In all five countries with official garment wages available, these wages are not far from the lower bound minimum wage; in two out of the five they even settle below that minimum wage, in Cambodia substantially and in Pakistan slightly.
In the eight countries (all except China) for which based on the WageIndicator Cost-of-Living Survey living wages could be estimated, the relative levels of the lower bound living wage for individuals vary widely. Cambodia is the only country where this living wage settles slightly below the lower bound minimum wage; for the other countries the individual living wage values range from 8 per cent (Pakistan) and 14 per cent (India) above the lower bound minimum wage up to 29 per cent (Bangladesh and Myanmar), 146 per cent (Sri Lanka), 174 per cent (Indonesia) and 219 per cent (Vietnam).
Figure 2: Wages in Context: Lower bound statutory minimum wage (=100, blue bars) related to the median garment wages (yellow bars), the lower bound living wage for individuals (green bars), and the lower bound living wage for typical families (red bars), nine countries
Source: Wages in Context in the Garment Industry in Asia. Amsterdam: WageIndicator Foundation, April 2016.
Wages in Context in the Garment Industry in Asia
This leaflet is based on a study undertaken for the Ministry of Foreign Affairs, the Netherlands, on behalf of the Asian Living Wage Conference (ALWC) in Pakistan in 2016. The ALWC aims to engage Asian textile-producing countries in the initiatives of EU and US brands and multi-stakeholder initiatives to implement living wages. The Ministry has asked the WageIndicator Foundation to prepare input for the Conference by providing insight into the cost of living and related living wage levels in the garment industries in Bangladesh, Cambodia, China, India, Indonesia, Myanmar, Pakistan, Sri Lanka, and Vietnam.
See Van Klaveren, M. (2016) Wages in Context in the Garment Industry in Asia. Amsterdam: WageIndicator Foundation, April.
http://www.wageindicator.org/main/Wageindicatorfoundation/publications
WageIndicator Cost-of-Living and Living Wage levels calculations
WageIndicator maintains a Cost-of-Living survey with related Living Wage calculations, as well as a Work-and-Wages survey, a Minimum Wages Database, and a Labour Law Database for some 80 countries. For this report, WageIndicator intensified the Cost-of-Living data-collection in the nine countries, and interviewed experts from the nine countries regarding the hurdles to implement Living Wages.
Three features are critical in the WageIndicator Living Wage computations. First, they are based on the cost of living for a predefined food basket derived from the FAO database distinguishing 50 food groups with national food consumption patterns in per capita units (checked to ensure the percentage of calories from proteins is consistent with WHO balance diet), for housing and for transportation, with a margin for unexpected expenses. Second, data about prices of these items is collected through a survey. For this purpose, the Internet is used as it reaches out to large numbers of people. This WageIndicator Cost-of-Living Survey invites web visitors on all WageIndicator websites to complete the survey for a single item or for the list of items. The survey is a multi-country, multilingual, continuous web survey, with a printed version and an App for offline data-collection. Third, in determining a Living Wage, WageIndicator assumes the Living Wage for a typical family referring to the family composition most common in the country at stake, calculated on the respective fertility rates.
See for information: Guzi, M., and Kahanec, M. (2014) Wageindicator Living Wages, Methodological Note. Bratislava/Amsterdam: CELSI/Wage; Guzi, M., Kahanec, M., Kabina, T. (2016) Codebook of the WageIndicator Cost-of-Living Survey. Amsterdam: WageIndicator Foundation
WageIndicator Foundation (www.wageindicator.org; office@wageindicator.org)
WageIndicator started in 2001 to contribute to a transparent labour market for workers and employers by publishing easily accessible information on a website. It collects, compares and shares labour market information through online and face-to-face surveys and desk research. It publishes the collected information on national websites, thereby serving as an online library for wage information, Labour Law, and career advice, both for workers/employees and employers. The websites attract a large audience, because they publish urgently needed but usually not easy accessible information, in 2015 resulting in more than 32 million visitors.


